The Electric Fleet Command Centre
An enterprise Vehicle Management System engineered to take the Akij Bashir Group commercial electric truck fleet from 2 trips per day to 5 trips per day — transforming utilisation, energy economics, maintenance discipline and executive visibility across every kilometre driven in Bangladesh.
Twelve chapters. One operating truth.
This document moves from global market context to the operational reality of your yard, to the platform that closes the gap — and to the financial case the Board must sign.
The Future of the Commercial EV Fleet
The global freight industry is mid-way through the largest powertrain transition in a century. Bangladesh's industrial groups will either lead it or import it late and expensively.
- Global electric commercial vehicle market
- Why commercial EV, and why now
- The fleet transformation curve
- International benchmarks: OEMs and operators
The commercial EV market is compounding, not creeping.
Global electric commercial vehicle deployment
Units on road, millions — actuals to 2025, outlook to 2032
Six forces make the electric truck an operating decision, not a green gesture.
Electrification without digitalisation is an expensive lateral move.
Value is not released when the truck arrives. It is released when the truck becomes a connected, scheduled, measured asset. Hover any stage to see what changes.
Eight global operators. One shared conclusion.
Every large-scale electric fleet programme in the world pairs the vehicle with a control platform. None of them run electric trucks on paper.
The Current Operating Reality
An honest diagnostic of where value leaks today — before a single line of software is proposed.
- Ten structural challenges in the current fleet
- The utilisation gap: why the day ends at 2 trips
- The cost of inaction, quantified
Ten challenges. Each one is a measurable cost line.
Select a challenge to see its operational signature and annualised impact on a 60-vehicle fleet.
The truck is not slow. The day around the truck is slow.
A 24-hour reconstruction of a typical vehicle-day. Productive movement is the thin band. Everything else is recoverable.
Vehicle-day reconstruction · Current state vs VMS-optimised state
Minutes allocated across a 24-hour operating window, averaged across the fleet
৳ 8.4 crore leaves the fleet every year without anyone approving it.
Annualised value leakage · 60-vehicle commercial fleet
BDT lakh per annum, by leakage category
“Nothing in this list is fraud. It is the ordinary arithmetic of an un-instrumented fleet — a hundred small decisions taken without data, compounding for twelve months.”
Fleet Digitalisation PracticeThe Vision — A Digital Fleet Command Centre
One room. One screen. Every vehicle, every driver, every kilowatt-hour, every taka — in real time.
- The Command Centre concept
- Four pillars: Smart, Connected, AI-driven, Paperless
- Target operating model — before and after
The Fleet Control Tower.
Every telemetry stream, work order, gate pass and charging session resolved into a single operating picture — refreshed every few seconds, owned by a named controller.
TOWER
Smart. Connected. AI-driven. Paperless.
Drag the handle. See the operating model change.
The Complete Vehicle Management System
Eighteen production modules, one data spine, three mobile applications and an executive portal — deployed as a single platform, not a collection of tools.
- Platform architecture
- Eighteen functional modules
- Fleet Overview dashboard
A layered platform, built for a decade of fleet growth.
Eighteen modules. Zero spreadsheets.
Select any module for its capability set and the operational KPI it moves.
Fleet Overview
Commercial EV & Battery Intelligence
The battery is the single most valuable component in the fleet — and the only one that degrades while parked. It must be managed, not merely charged.
- The fleet vehicle — SANY SE588kWh electric prime mover
- Battery health, state of charge, thermal management
- Charging optimisation, queueing and tariff arbitrage
- Energy consumption, range prediction, regeneration
The vehicle: SANY SE588kWh electric prime mover.
Akij Bashir Group is deploying the SANY SE588kWh — a 6×4 battery-electric heavy tractor engineered for precisely the long-duty, high-utilisation cycle this platform exists to maximise.
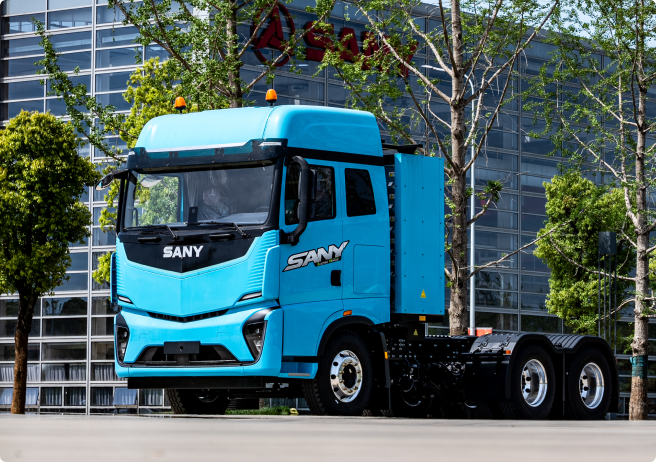
Two variants, one platform
Configured to the corridor and load profile
Every cell pack, under continuous surveillance.
State of health distribution
Fleet-wide SoH, 60 packs
Live state of charge
Selected vehicles, real time
Pack thermal envelope
Cell temperature vs safe band, °C
Battery lifecycle management
Predicted degradation curve with and without VMS-governed charging discipline
Charge at the right hour, at the right speed, in the right order.
Tariff-aware charging schedule
Grid tariff (৳/kWh) against fleet charging load — unmanaged vs VMS-optimised
Live charging queue
Depot 01 · Dhaka · 8 bays
Range anxiety is a data problem. We solve it with data.
Energy consumption vs payload
kWh / km against gross vehicle weight, 30-day sample
Predictive range model
Remaining range vs route demand — Dhaka → Narayanganj → Gazipur
Fleet Operations & AI Dispatch
This is where the second, third, fourth and fifth trip of the day are created.
- The digital dispatch workflow, end to end
- AI route optimisation and live tracking
- Digital gate pass, QR dispatch, proof of delivery
From order to proof of delivery in eight governed steps.
Select any step to see the system action, the human action, and the minutes removed from the current process.
Live Map & AI Dispatch
The gate pass, the challan and the delivery receipt become data.
- Vehicle
- DHK-METRO-TA 21-4409
- Driver
- Md. Rafiqul Islam · D-0142
- Load
- Cement · 9.4 T · Akij Cement Ltd
- Approved
- Digitally · 00:41 sec
Maintenance & the Digital Workshop
A vehicle in the workshop cannot make a fifth trip. Availability is a maintenance KPI before it is an operations KPI.
- Preventive, predictive and corrective strategy
- The digital workshop and job-card workflow
- Downtime, spare parts and warranty recovery
Move the fleet from breakdown-driven to failure-anticipating.
Corrective
The vehicle fails. The trip is cancelled. The workshop reacts. Parts are sourced under pressure at a premium.
- Unplanned downtime
- Premium spare pricing
- Cancelled revenue trips
Preventive
Service triggered by kilometres, hours or calendar — scheduled into low-demand windows by the dispatch engine itself.
- Auto-generated job cards
- Parts reserved in advance
- Zero surprise to operations
Predictive
Telemetry anomalies — pack thermal drift, motor current signature, brake regen decay — raise a work order before failure.
- AI failure prediction
- 7–21 day warning window
- Repair at convenience, not crisis
Maintenance mix migration · 24 months
Share of total workshop hours by intervention type
Digital Workshop
Downtime is the most expensive line item nobody invoices for.
Fleet availability trajectory
% of fleet road-ready at 06:00 dispatch call
Spare parts & inventory intelligence
Stock cover vs consumption, top 8 EV-critical parts
Driver & Staff Management
The driver is the single largest variable in energy consumption, safety exposure and trip completion. Measure them fairly, and they will outperform the model.
- Driver lifecycle — attendance to licence to training
- Safety and efficiency scorecards
- Ranking, reward and penalty framework
One driver record. Four mobile applications.
Driver Performance & Safety Scorecard
Analytics & the Executive Dashboard
The Board should not wait for a monthly report to learn what the fleet did yesterday.
- The Executive Dashboard
- Utilisation heatmaps and demand patterns
- AI insight engine and forward forecast
Executive Dashboard
Where the capacity is hiding.
Fleet utilisation heatmap
Vehicles actively on trip, by hour and weekday — 90-day mean
The 13:00–16:00 collapse
Fleet utilisation drops to 22% every afternoon — drivers return for lunch and dispatch does not re-task the vehicle. This window alone contains 1.4 recoverable trips per vehicle per day.
Stagger shift breaks, chain the third trip
Rotating driver breaks in two waves and pre-assigning the afternoon consignment at 11:00 converts the dead zone into +1.4 trips/vehicle/day with the existing headcount.
The system does not report the past. It proposes the next action.
Demand & trips-per-day forecast
Actual vs AI forecast with 90% confidence band, 12-month horizon
AI Recommendation Engine
Ranked actions, generated 06:00 today
ROI & Financial Impact
Electric versus diesel. Total cost of ownership. Payback period. The number the Board will be asked to approve.
- EV vs diesel total cost of ownership
- Payback period and five-year value
- Live ROI calculator — test our assumptions
Electric wins on the running line, not the sticker line.
Seven-year TCO per vehicle · Diesel vs Electric vs Electric + VMS
BDT lakh, discounted, 60,000 km per annum duty cycle
Move the assumptions. The business case recalculates live.
Your assumptions
Recovered capacity is only revenue where there is freight to carry it, and a recovered trip still consumes energy, driver hours and wear. Both are deducted before any return is claimed.
How two trips a day become five.
Not one big idea — nine disciplined ones. This is the bridge, lever by lever, with the trip contribution of each.
Trips per vehicle per day · contribution bridge
Each lever quantified independently and net of overlap
Risk, Compliance & ESG
A fleet platform is also a governance instrument. Every action time-stamped, every approval attributable, every emission accounted.
- Safety, incident and SOS management
- ISO 39001 & ISO 55001 alignment, audit trail
- Carbon accounting and the ESG dashboard
Standards-aligned by design, not by remediation.
Immutable audit trail
Append-only event log · live sample
The emissions report writes itself.
Fleet carbon trajectory
Tonnes CO₂e per annum · Scope 1 & Scope 2, 60 vehicles
ESG scorecard
Board-reportable, auto-generated monthly
Future AI, Digital Twin & the Roadmap
What we build in Year 1 is the foundation. What it becomes in Year 3 is a self-optimising freight network.
- AI Dispatcher and the Digital Twin fleet
- Eight-phase transformation roadmap
- Why this partner, and the decision requested
The Digital Twin — simulate tomorrow before you dispatch it.
Eight phases. Eighteen months. Value from month three.
Select a phase for scope, duration, owner and the value released.
Fourteen reasons this is the right platform for Akij Bashir Group.
Approve the pilot.
Twelve vehicles. Ninety days.
The numbers will argue for themselves.
Mahfuz Akand
Solution Architect & Full-Stack Engineer · 10+ years building enterprise software, real-time dashboards and AI-driven products.